将数据通过深度学习模型转化为Embeddings,可以获得原始数据的有意义表征。HDBSCAN(基于密度的有噪声应用空间分层聚类)通过分析数据点的密度进行分组。它可以发现不同形状和大小聚类特别有用。HDBSCAN (Hierarchical Density-Based Spatial Clustering of Applications with Noise)是一种聚类算法,它依赖于计算嵌入空间中数据点之间的距离。 <!--more--> ## 准备数据 ``` pip install "pymilvus[model]" pip install hdbscan pip install plotly pip install umap-learn ``` ## 提取Embeddings ```python from openai import OpenAI openai_client = OpenAI(api_key="b5f67c0f6b67", base_url="http://14.103.139.62:8000/v1") def emb_text(text): return ( openai_client.embeddings.create(input=text, model="/data/llm/Qwen/Qwen3-Embeding-0.6B") .data[0] .embedding ) test_embedding = emb_text("This is a test") embedding_dim = len(test_embedding) print(embedding_dim) print(test_embedding[:10]) ``` 1024 [-0.0101318359375, -0.0299072265625, -0.0115966796875, -0.060546875, -0.0023651123046875, 0.016845703125, -0.03955078125, 0.0311279296875, -0.024169921875, 0.0] ```python import pandas as pd from dotenv import load_dotenv from pymilvus.model.hybrid import BGEM3EmbeddingFunction from pymilvus import FieldSchema, Collection, connections, CollectionSchema, DataType df = pd.read_csv("news_data_dedup.csv") docs = [ f"{title}\n{description}" for title, description in zip(df.title, df.description) ] for item in docs[:10]: print(item+"\n") ``` /home/sichen/anaconda3/envs/jupyterlab/lib/python3.12/site-packages/tqdm/auto.py:21: TqdmWarning: IProgress not found. Please update jupyter and ipywidgets. See https://ipywidgets.readthedocs.io/en/stable/user_install.html from .autonotebook import tqdm as notebook_tqdm Harvey Weinstein's 2020 rape conviction overturned Victims group describes the New York appeal court's decision to retry Hollywood mogul as "profoundly unjust". Police and activists clash on Atlanta campus amid Gaza protests Meanwhile, hundreds of students march in Washington DC, and congresswoman Ilhan Omar joins protesters at a New York campus. Haiti PM resigns as transitional council sworn in The council will try to restore order and form a new government in the nation gripped by gang violence. Europe risks dying and faces big decisions - Macron The French president delivers a stark warning for Europe to act fast to survive in a changing world. Prosecutors ask for halt to case against Spain PM's wife Pedro Sánchez is deciding whether to resign after a case against his wife by an anti-corruption group. WATCH: Would you pay a tourist fee to enter Venice? From Thursday visitors making a trip to the famous city at peak times will be charged a trial entrance fee. Supreme Court divided on whether Trump has immunity The justices discussed immunity, coups, pardons, Operation Mongoose - and the future of democracy. More than 150 killed as heavy rains pound Tanzania The prime minister warns that El Niño-triggered heavy rains are likely to continue into May. Playboy model's interview 'aggravated' Trump, court hears A tabloid publisher testifies the then-president didn't understand why he let Karen McDougal speak to media. Paris's Moulin Rouge loses windmill sails overnight The cause of the sails' collapse from the roof of the world famous cabaret club is not yet clear. ```python from tqdm import tqdm data = [] for i, line in enumerate(tqdm(docs, desc="Creating embeddings")): #data.append({"id": i, "embedding": emb_text(line), "text": line}) data.append(emb_text(line)) #print(data[:1]) ``` Creating embeddings: 100%|██████████| 870/870 [00:18<00:00, 46.00it/s] ```python connections.connect(uri="milvus_hdbscan.db") ``` ```python fields = [ FieldSchema( name="id", dtype=DataType.INT64, is_primary=True, auto_id=True ), # Primary ID field FieldSchema( name="embedding", dtype=DataType.FLOAT_VECTOR, dim=1024 ), # Float vector field (embedding) FieldSchema( name="text", dtype=DataType.VARCHAR, max_length=65535 ), # Float vector field (embedding) ] schema = CollectionSchema(fields=fields, description="Embedding collection") collection = Collection(name="news_data", schema=schema) for doc, embedding in zip(docs, data): collection.insert({"text": doc, "embedding": embedding}) print(doc) index_params = {"index_type": "FLAT", "metric_type": "L2", "params": {}} collection.create_index(field_name="embedding", index_params=index_params) collection.flush() ``` ## HDBSCAN 构建距离矩阵 HDBSCAN 需要计算点与点之间的距离来进行聚类,这可能需要大量计算。由于远处的点对聚类分配的影响较小,我们可以通过计算前 k 个近邻来提高效率。在本例中,我们使用的是 FLAT 索引,但对于大规模数据集,Milvus 支持更高级的索引方法来加速搜索过程。 首先,我们需要获取一个迭代器来迭代之前创建的 Milvus Collections。 ```python import hdbscan import numpy as np import pandas as pd import plotly.express as px from umap import UMAP from pymilvus import Collection collection = Collection(name="news_data") collection.load() iterator = collection.query_iterator( batch_size=10, expr="id > 0", output_fields=["id", "embedding"] ) search_params = { "metric_type": "L2", "params": {"nprobe": 10}, } # L2 is Euclidean distance ids = [] dist = {} embeddings = [] ``` 将遍历 Milvus Collections 中的所有嵌入。对于每个 Embeddings,我们将搜索其在同一 Collections 中的前 k 个邻居,获取它们的 id 和距离。然后,我们还需要创建一个字典,将原始 ID 映射到距离矩阵中的连续索引。完成后,我们需要创建一个初始化所有元素为无穷大的距离矩阵,并填充我们搜索到的元素。这样,远距离点之间的距离将被忽略。最后,我们使用 HDBSCAN 库,利用我们创建的距离矩阵对点进行聚类。我们需要将度量值设置为 "预计算",以表明数据是距离矩阵而非原始嵌入。 ```python while True: batch = iterator.next() batch_ids = [data["id"] for data in batch] # 所有id集合 ids.extend(batch_ids) # 嵌入集合 query_vectors = [data["embedding"] for data in batch] embeddings.extend(query_vectors) results = collection.search( data=query_vectors, limit=50, anns_field="embedding", param=search_params, output_fields=["id"], ) for i, batch_id in enumerate(batch_ids): dist[batch_id] = [] for result in results[i]: dist[batch_id].append((result.id, result.distance)) if len(batch) == 0: break ids2index = {} for id in dist: ids2index[id] = len(ids2index) dist_metric = np.full((len(ids), len(ids)), np.inf, dtype=np.float64) for id in dist: for result in dist[id]: dist_metric[ids2index[id]][ids2index[result[0]]] = result[1] h = hdbscan.HDBSCAN(min_samples=3, min_cluster_size=3, metric="precomputed") hdb = h.fit(dist_metric) print(hdb) ``` HDBSCAN(metric='precomputed', min_cluster_size=3, min_samples=3) /home/sichen/anaconda3/envs/jupyterlab/lib/python3.12/site-packages/hdbscan/hdbscan_.py:142: UserWarning: The minimum spanning tree contains edge weights with value infinity. Potentially, you are missing too many distances in the initial distance matrix for the given neighborhood size. ## UMAP 进行聚类可视化 我们已经使用 HDBSCAN 对数据进行了聚类,并获得了每个数据点的标签。不过,利用一些可视化技术,我们可以获得聚类的全貌,以便进行直观分析。现在,我们将使用 UMAP 对聚类进行可视化。UMAP 是一种用于降维的高效方法,它在保留高维数据结构的同时,将其投影到低维空间,以便进行可视化或进一步分析。有了它,我们就能在二维或三维空间中可视化原始高维数据,并清楚地看到聚类。 在这里,我们再次遍历数据点,获取原始数据的 ID 和文本,然后使用 ploty 将数据点与这些元信息绘制成图,并用不同的颜色代表不同的聚类。 ```python import plotly.io as pio pio.renderers.default = "notebook" umap = UMAP(n_components=2, random_state=42, n_neighbors=80, min_dist=0.1) df_umap = ( pd.DataFrame(umap.fit_transform(np.array(embeddings)), columns=["x", "y"]) .assign(cluster=lambda df: hdb.labels_.astype(str)) .query('cluster != "-1"') .sort_values(by="cluster") ) iterator = collection.query_iterator( batch_size=10, expr="id > 0", output_fields=["id", "text"] ) ids = [] texts = [] while True: batch = iterator.next() if len(batch) == 0: break batch_ids = [data["id"] for data in batch] batch_texts = [data["text"] for data in batch] ids.extend(batch_ids) texts.extend(batch_texts) show_texts = [texts[i] for i in df_umap.index] df_umap["hover_text"] = show_texts fig = px.scatter( df_umap, x="x", y="y", color="cluster", hover_data={"hover_text": True} ) fig.show() ``` 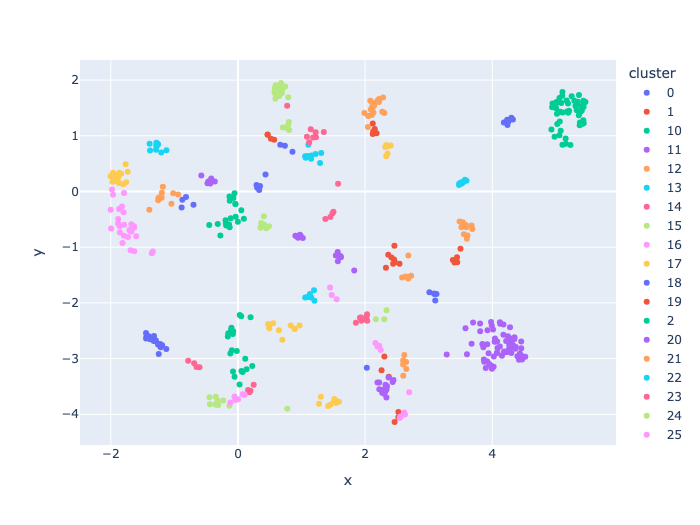 Loading... 将数据通过深度学习模型转化为Embeddings,可以获得原始数据的有意义表征。HDBSCAN(基于密度的有噪声应用空间分层聚类)通过分析数据点的密度进行分组。它可以发现不同形状和大小聚类特别有用。HDBSCAN (Hierarchical Density-Based Spatial Clustering of Applications with Noise)是一种聚类算法,它依赖于计算嵌入空间中数据点之间的距离。 <!--more--> ## 准备数据 ``` pip install "pymilvus[model]" pip install hdbscan pip install plotly pip install umap-learn ``` ## 提取Embeddings ```python from openai import OpenAI openai_client = OpenAI(api_key="b5f67c0f6b67", base_url="http://14.103.139.62:8000/v1") def emb_text(text): return ( openai_client.embeddings.create(input=text, model="/data/llm/Qwen/Qwen3-Embeding-0.6B") .data[0] .embedding ) test_embedding = emb_text("This is a test") embedding_dim = len(test_embedding) print(embedding_dim) print(test_embedding[:10]) ``` 1024 [-0.0101318359375, -0.0299072265625, -0.0115966796875, -0.060546875, -0.0023651123046875, 0.016845703125, -0.03955078125, 0.0311279296875, -0.024169921875, 0.0] ```python import pandas as pd from dotenv import load_dotenv from pymilvus.model.hybrid import BGEM3EmbeddingFunction from pymilvus import FieldSchema, Collection, connections, CollectionSchema, DataType df = pd.read_csv("news_data_dedup.csv") docs = [ f"{title}\n{description}" for title, description in zip(df.title, df.description) ] for item in docs[:10]: print(item+"\n") ``` /home/sichen/anaconda3/envs/jupyterlab/lib/python3.12/site-packages/tqdm/auto.py:21: TqdmWarning: IProgress not found. Please update jupyter and ipywidgets. See https://ipywidgets.readthedocs.io/en/stable/user_install.html from .autonotebook import tqdm as notebook_tqdm Harvey Weinstein's 2020 rape conviction overturned Victims group describes the New York appeal court's decision to retry Hollywood mogul as "profoundly unjust". Police and activists clash on Atlanta campus amid Gaza protests Meanwhile, hundreds of students march in Washington DC, and congresswoman Ilhan Omar joins protesters at a New York campus. Haiti PM resigns as transitional council sworn in The council will try to restore order and form a new government in the nation gripped by gang violence. Europe risks dying and faces big decisions - Macron The French president delivers a stark warning for Europe to act fast to survive in a changing world. Prosecutors ask for halt to case against Spain PM's wife Pedro Sánchez is deciding whether to resign after a case against his wife by an anti-corruption group. WATCH: Would you pay a tourist fee to enter Venice? From Thursday visitors making a trip to the famous city at peak times will be charged a trial entrance fee. Supreme Court divided on whether Trump has immunity The justices discussed immunity, coups, pardons, Operation Mongoose - and the future of democracy. More than 150 killed as heavy rains pound Tanzania The prime minister warns that El Niño-triggered heavy rains are likely to continue into May. Playboy model's interview 'aggravated' Trump, court hears A tabloid publisher testifies the then-president didn't understand why he let Karen McDougal speak to media. Paris's Moulin Rouge loses windmill sails overnight The cause of the sails' collapse from the roof of the world famous cabaret club is not yet clear. ```python from tqdm import tqdm data = [] for i, line in enumerate(tqdm(docs, desc="Creating embeddings")): #data.append({"id": i, "embedding": emb_text(line), "text": line}) data.append(emb_text(line)) #print(data[:1]) ``` Creating embeddings: 100%|██████████| 870/870 [00:18<00:00, 46.00it/s] ```python connections.connect(uri="milvus_hdbscan.db") ``` ```python fields = [ FieldSchema( name="id", dtype=DataType.INT64, is_primary=True, auto_id=True ), # Primary ID field FieldSchema( name="embedding", dtype=DataType.FLOAT_VECTOR, dim=1024 ), # Float vector field (embedding) FieldSchema( name="text", dtype=DataType.VARCHAR, max_length=65535 ), # Float vector field (embedding) ] schema = CollectionSchema(fields=fields, description="Embedding collection") collection = Collection(name="news_data", schema=schema) for doc, embedding in zip(docs, data): collection.insert({"text": doc, "embedding": embedding}) print(doc) index_params = {"index_type": "FLAT", "metric_type": "L2", "params": {}} collection.create_index(field_name="embedding", index_params=index_params) collection.flush() ``` ## HDBSCAN 构建距离矩阵 HDBSCAN 需要计算点与点之间的距离来进行聚类,这可能需要大量计算。由于远处的点对聚类分配的影响较小,我们可以通过计算前 k 个近邻来提高效率。在本例中,我们使用的是 FLAT 索引,但对于大规模数据集,Milvus 支持更高级的索引方法来加速搜索过程。 首先,我们需要获取一个迭代器来迭代之前创建的 Milvus Collections。 ```python import hdbscan import numpy as np import pandas as pd import plotly.express as px from umap import UMAP from pymilvus import Collection collection = Collection(name="news_data") collection.load() iterator = collection.query_iterator( batch_size=10, expr="id > 0", output_fields=["id", "embedding"] ) search_params = { "metric_type": "L2", "params": {"nprobe": 10}, } # L2 is Euclidean distance ids = [] dist = {} embeddings = [] ``` 将遍历 Milvus Collections 中的所有嵌入。对于每个 Embeddings,我们将搜索其在同一 Collections 中的前 k 个邻居,获取它们的 id 和距离。然后,我们还需要创建一个字典,将原始 ID 映射到距离矩阵中的连续索引。完成后,我们需要创建一个初始化所有元素为无穷大的距离矩阵,并填充我们搜索到的元素。这样,远距离点之间的距离将被忽略。最后,我们使用 HDBSCAN 库,利用我们创建的距离矩阵对点进行聚类。我们需要将度量值设置为 "预计算",以表明数据是距离矩阵而非原始嵌入。 ```python while True: batch = iterator.next() batch_ids = [data["id"] for data in batch] # 所有id集合 ids.extend(batch_ids) # 嵌入集合 query_vectors = [data["embedding"] for data in batch] embeddings.extend(query_vectors) results = collection.search( data=query_vectors, limit=50, anns_field="embedding", param=search_params, output_fields=["id"], ) for i, batch_id in enumerate(batch_ids): dist[batch_id] = [] for result in results[i]: dist[batch_id].append((result.id, result.distance)) if len(batch) == 0: break ids2index = {} for id in dist: ids2index[id] = len(ids2index) dist_metric = np.full((len(ids), len(ids)), np.inf, dtype=np.float64) for id in dist: for result in dist[id]: dist_metric[ids2index[id]][ids2index[result[0]]] = result[1] h = hdbscan.HDBSCAN(min_samples=3, min_cluster_size=3, metric="precomputed") hdb = h.fit(dist_metric) print(hdb) ``` HDBSCAN(metric='precomputed', min_cluster_size=3, min_samples=3) /home/sichen/anaconda3/envs/jupyterlab/lib/python3.12/site-packages/hdbscan/hdbscan_.py:142: UserWarning: The minimum spanning tree contains edge weights with value infinity. Potentially, you are missing too many distances in the initial distance matrix for the given neighborhood size. ## UMAP 进行聚类可视化 我们已经使用 HDBSCAN 对数据进行了聚类,并获得了每个数据点的标签。不过,利用一些可视化技术,我们可以获得聚类的全貌,以便进行直观分析。现在,我们将使用 UMAP 对聚类进行可视化。UMAP 是一种用于降维的高效方法,它在保留高维数据结构的同时,将其投影到低维空间,以便进行可视化或进一步分析。有了它,我们就能在二维或三维空间中可视化原始高维数据,并清楚地看到聚类。 在这里,我们再次遍历数据点,获取原始数据的 ID 和文本,然后使用 ploty 将数据点与这些元信息绘制成图,并用不同的颜色代表不同的聚类。 ```python import plotly.io as pio pio.renderers.default = "notebook" umap = UMAP(n_components=2, random_state=42, n_neighbors=80, min_dist=0.1) df_umap = ( pd.DataFrame(umap.fit_transform(np.array(embeddings)), columns=["x", "y"]) .assign(cluster=lambda df: hdb.labels_.astype(str)) .query('cluster != "-1"') .sort_values(by="cluster") ) iterator = collection.query_iterator( batch_size=10, expr="id > 0", output_fields=["id", "text"] ) ids = [] texts = [] while True: batch = iterator.next() if len(batch) == 0: break batch_ids = [data["id"] for data in batch] batch_texts = [data["text"] for data in batch] ids.extend(batch_ids) texts.extend(batch_texts) show_texts = [texts[i] for i in df_umap.index] df_umap["hover_text"] = show_texts fig = px.scatter( df_umap, x="x", y="y", color="cluster", hover_data={"hover_text": True} ) fig.show() ```  最后修改:2025 年 12 月 09 日 © 允许规范转载 赞 如果觉得我的文章对你有用,请随意赞赏